
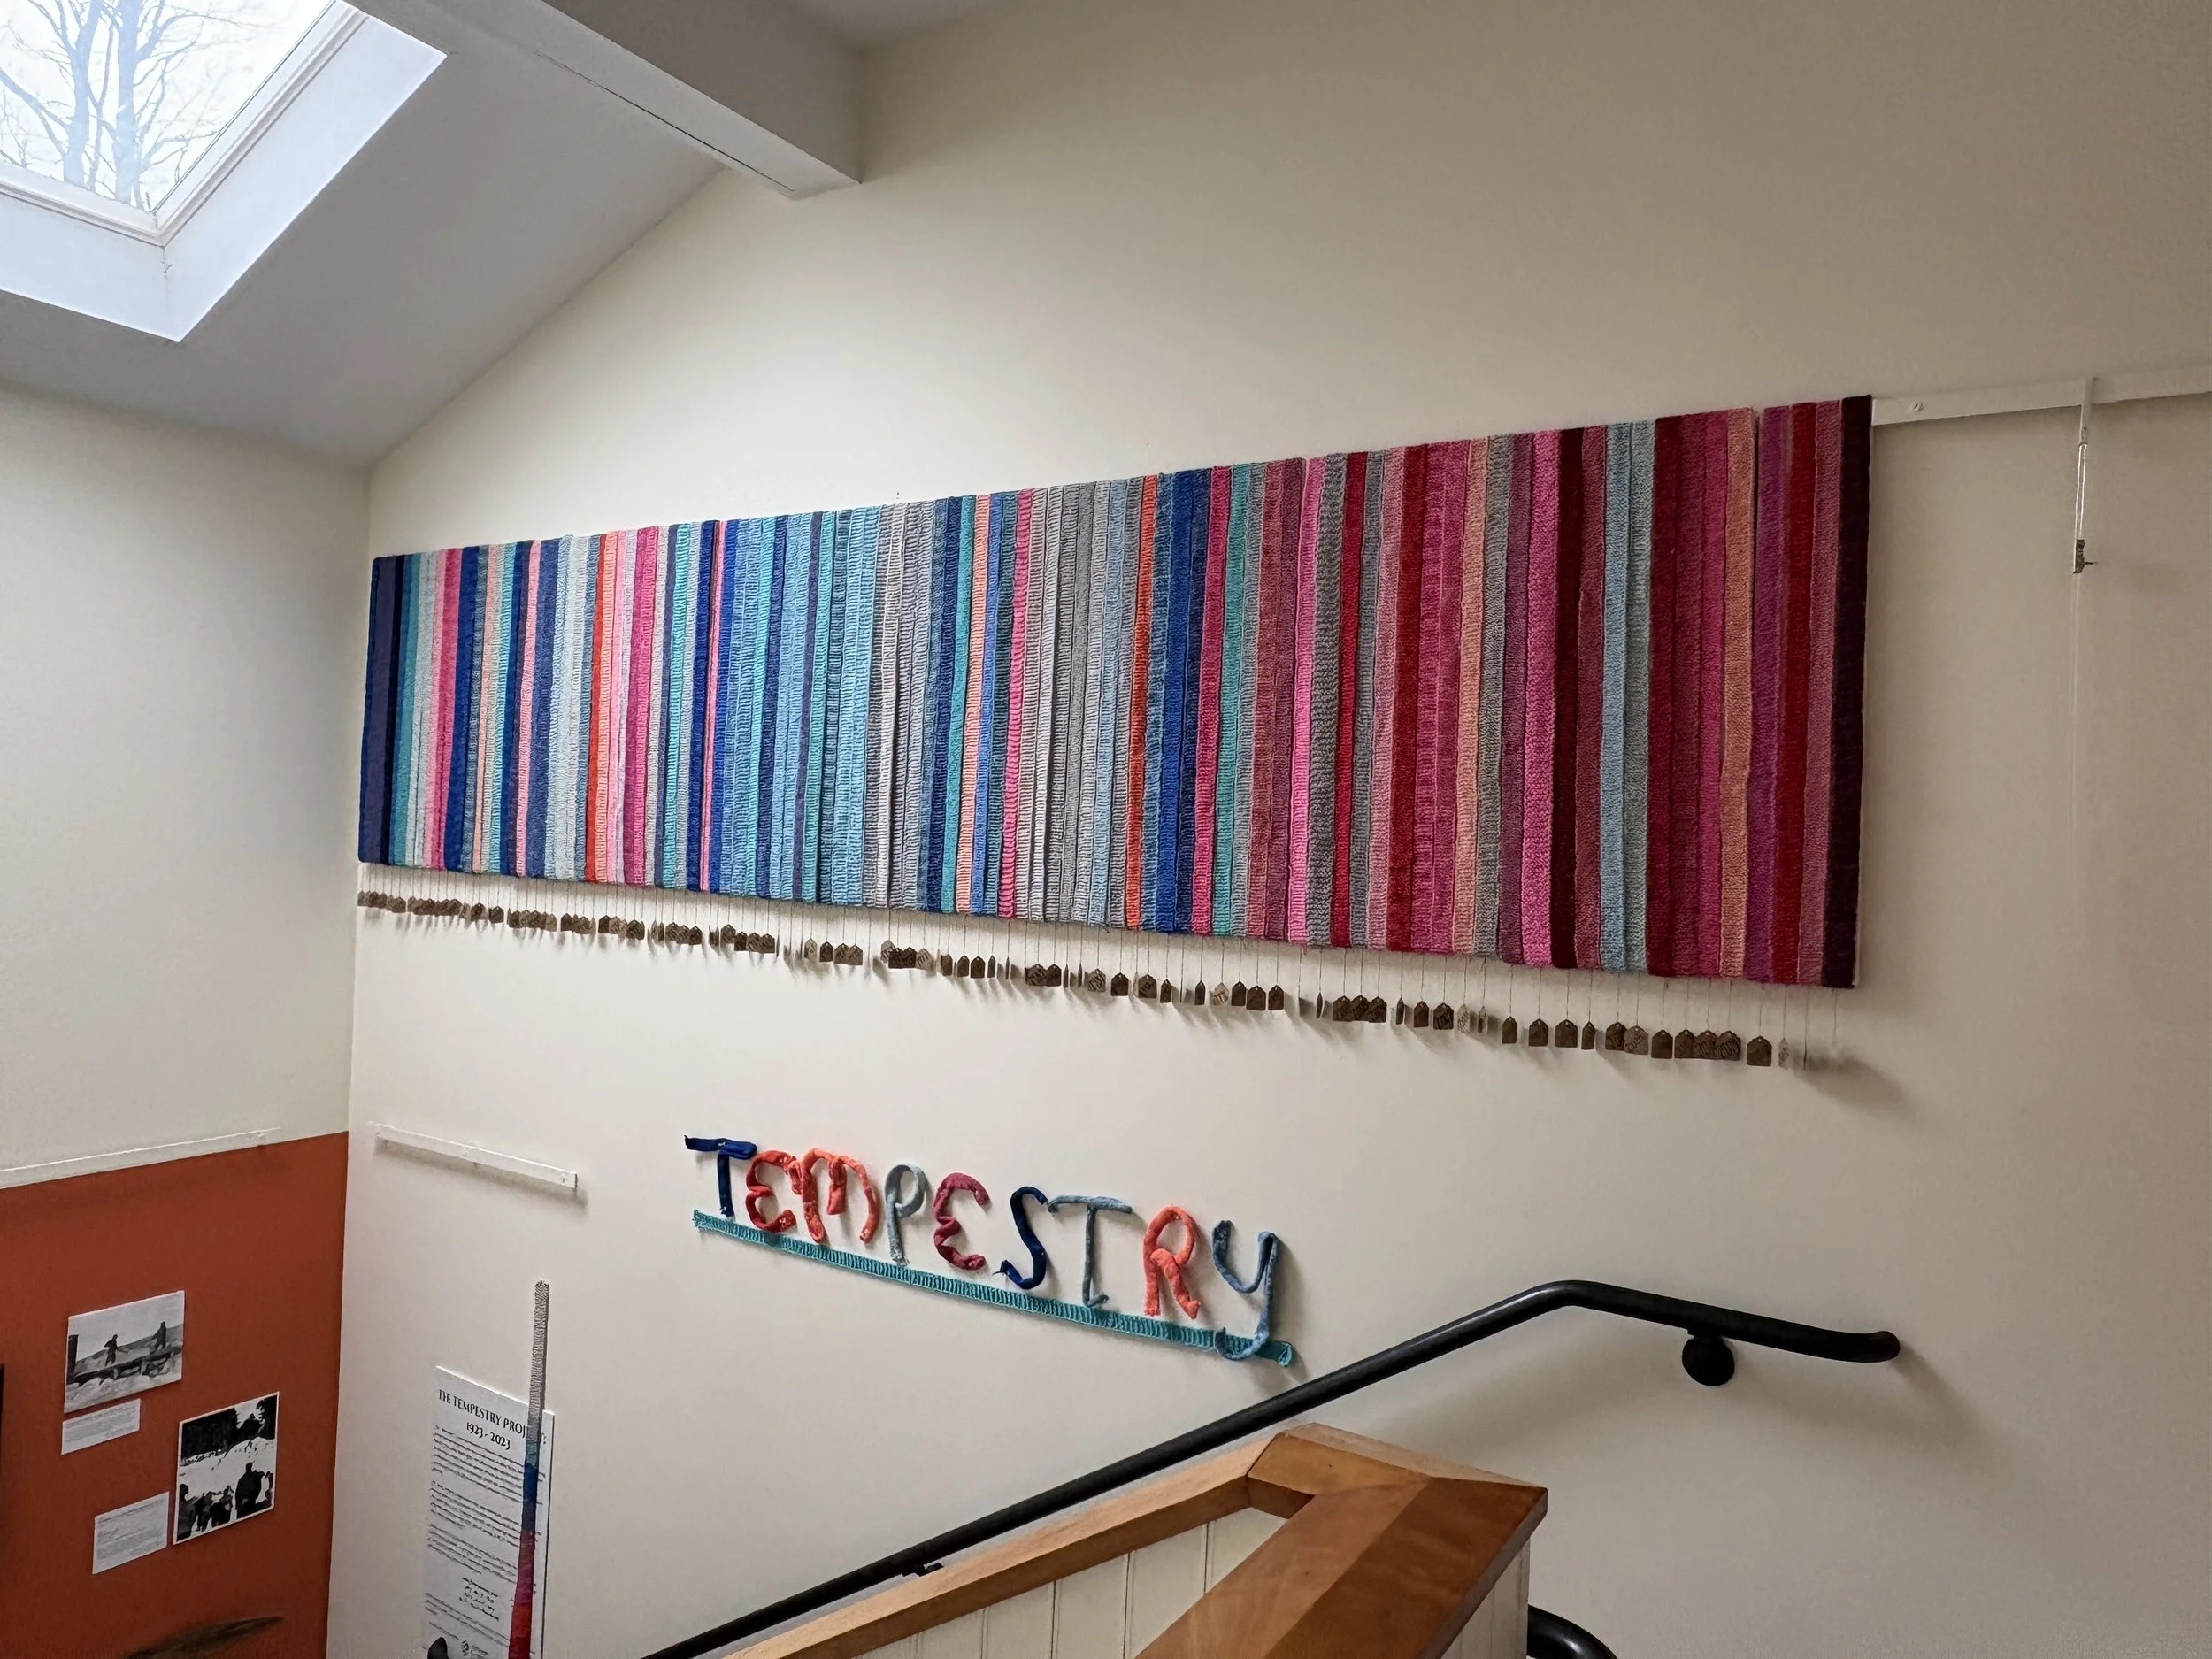
Average temperatures in Addison County from 1923 -2023. Blue represents lower temperatures and red represents higher temperatures. Graph provided by Mike Roy - Climate Economy Action Network.
Now On View
May 20 ,2026 - January 2, 2027
Our “tempestry” is a knitted textile that translates climate data through color, turning annual average temperatures into a visual record.
Inspired by the Tempestry Project based in Anacortes, Washington, this effort brought together knitters across our community to create a collective portrait of local climate history. Each participant contributed a knitted strip representing a single year, and together these pieces form a continuous record of 100 years of average temperatures in Addison County, Vermont
The colors range from the darkest blue, representing the coldest year, through lighter blues and greys as temperatures rise to pinks and deep reds for the warmest years. The coldest year in our tempestry was 1926, with an average temperature of 39°F, while the warmest year was 2012, with an average of 46.2°F, followed closely by 2023, which averaged 45.6°F
Locally sourced and hand-dyed wool was provided by the Museum, and knitters of all skill levels—from beginners to experienced fiber artists—were invited to participate. Donna Perrin of Creek Road Farm generously donated the wool from her flock of Corriedale sheep.
Color & Temperature Chart
39 °F - 41.7 °F = Blues
41.8 °F - 42.2 °F = Greys
42.3 °F - 46.2 °F = Pinks & Reds
HSM’s Tempestry Project was curated by Coco Moseley in collaboration with Ellery Foutch, Cindy Hill, Mike Roy, Middlebury Energy Committee, Middlebury Studio School and our community of knitters.
Generously funded by a Vermont Community Foundation Arts & Social Cohesion Grant.